Where has all the power gone?
Kai Scharrmann, Roy Hali, Ryuji Nishizawa
·
18.08.2025
Power Electronics
·
5 min. reading duration
Energy efficiency is essential for creating a low-emission or even carbon-neutral future. It plays a crucial role in the transition from combustion engines to electric vehicles and minimizing the impact of power-hungry AI applications on data center energy consumption. Understanding where power is lost – whether in converters, motors, or data centers – is key to unlocking significant efficiency gains and addressing the growing demand for energy in a sustainable way.
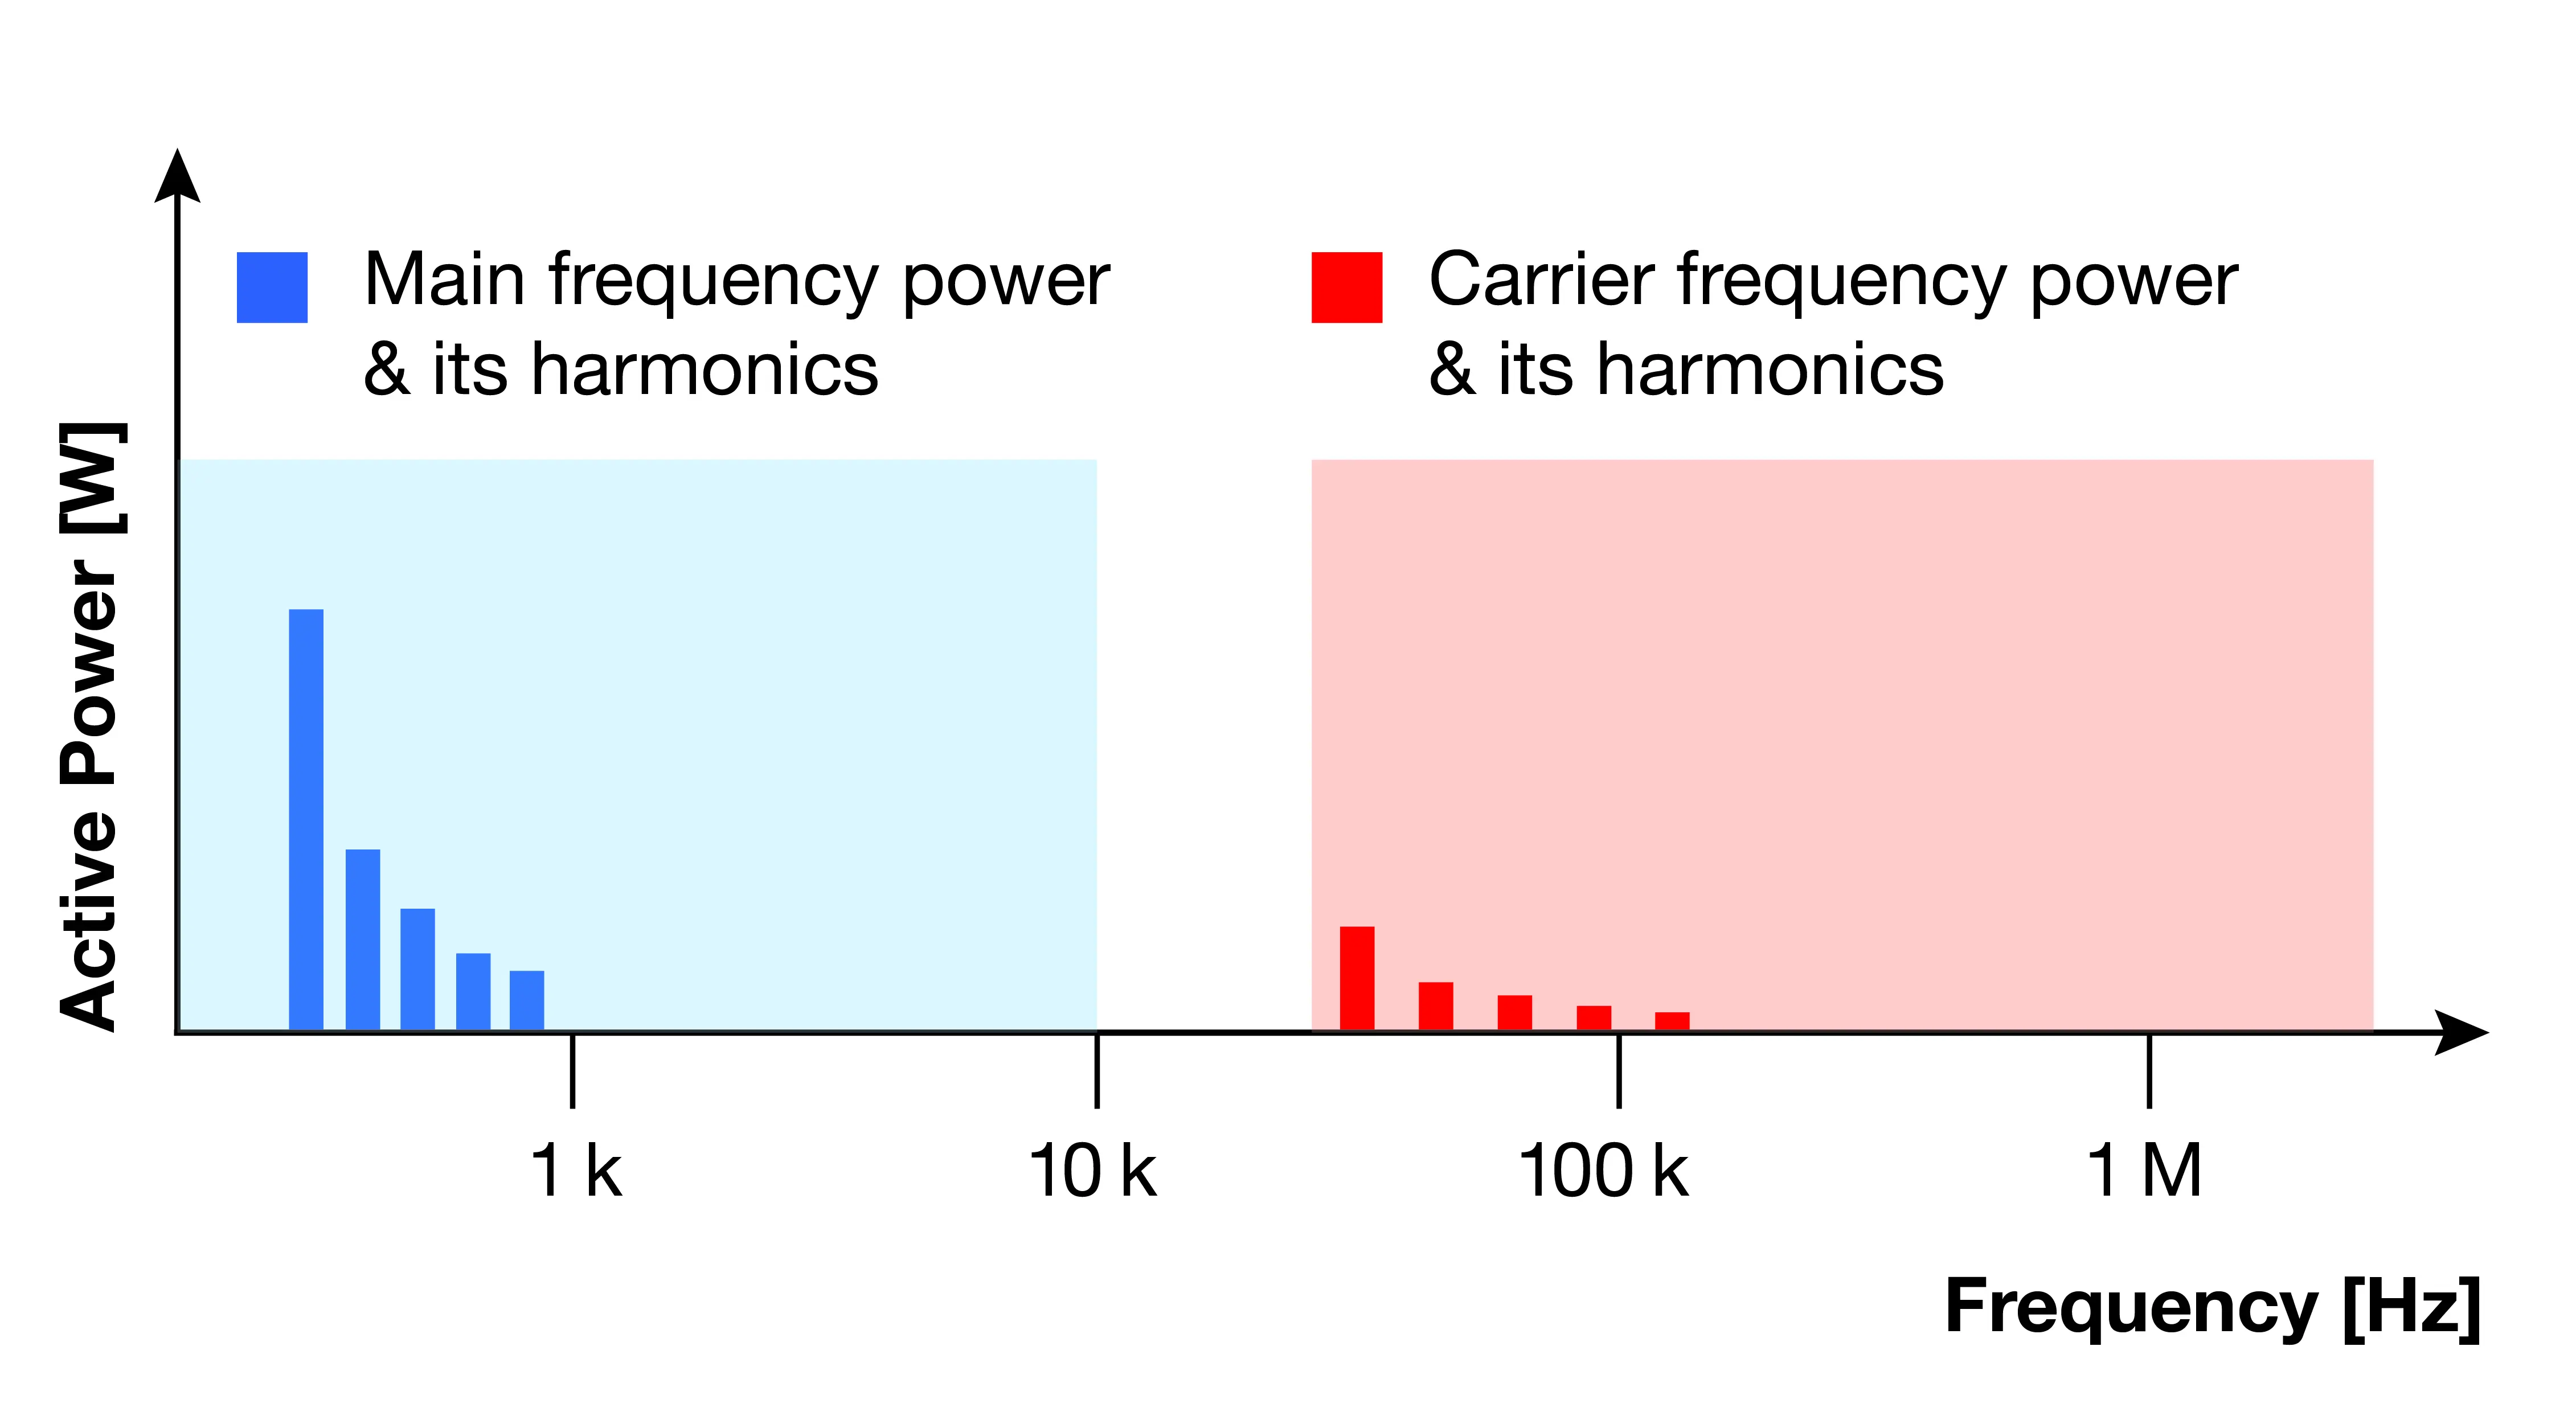
Active power is the portion of power consumed by a system to perform useful work, such as driving motors, powering machines, or running devices. However, only the main power component directly contributes to this work; the rest, known as harmonic power, is lost as vibration, noise, and heat.
Reducing harmonics is therefore crucial for engineers to minimize energy losses.
Measuring harmonics accurately
A power analyzer calculates the efficiency of an electrical system like a motor or transformer by measuring both the fundamental and harmonic components of power. At high frequencies and high currents, this becomes challenging: accurate measurement requires high-quality current sensors. These sensors must not only maintain accuracy across the entire frequency range, but their phase shift also needs to be known in order to calculate power correctly. To make matters worse, the phase shift of a current sensor is typically frequency dependent. Unless a sensor has a consistent time delay across all frequencies, accurate power measurements are difficult – regardless of the analyzer used.
Current Sensors and Power Analyzer - Engineered Together
What happens if your power analyzer and current sensor combination doesn’t meet high-frequency measurement requirements? When measuring the efficiency of an inverter using SiC semiconductors with a carrier frequency of 50 kHz or higher, your setup might yield efficiency values that exceed reality – sometimes even suggesting efficiencies over 100%. While such an extreme result is an obvious red flag, a more concerning scenario is when the analyzer shows 96% efficiency instead of the true 94% – or 96% instead of the true 98% – due to limitations of the current sensors. This is the real issue: how would you know? The key is to not only rely on the power analyzer's specified accuracies but also consider the current sensors' impact.
As an example, consider the power losses in a motor system. In such systems, harmonics of the main frequency are converted into noise and vibration, which can be identified without direct power measurements. However, high-frequency harmonic power is primarily converted into heat within the motor. Measuring this high-frequency power is challenging due to the motor’s inductive nature: at higher frequencies, the phase angle between voltage and current approaches 90°. Since active AC power is calculated as Voltage × Current × cos(θ), any phase error pushing this phase angle beyond 90° results in a negative measured power loss – appearing as a false gain!
The reason for this inaccurate measurement is an uncompensated phase error of the current sensor. Such phase errors distort the measurement and can lead to incorrect conclusions about a system's energy losses. There is a solution to this: With the right combination of power analyzer and current sensors made for power measurement, phase errors can be corrected ensuring accurate power measurements even for high currents and high frequencies. This lets you know precisely how much power is lost in your system. However, the next crucial question is: where exactly these losses occur – and how to trace them?
Identify Your Losses Accurately - Across All Frequencies
Power analyzers offer various features to determine at which frequencies power losses occur. A traditional method is harmonics analysis, which uses the motor’s main frequency as a base. Since motor main frequencies are typically low, harmonics analysis is generally limited to frequencies below 100 kHz. As an example, with a 50 Hz fundamental frequency, the 2000th harmonic corresponds to 100 kHz – which already marks the practical upper limit for harmonic power analysis in most instruments.
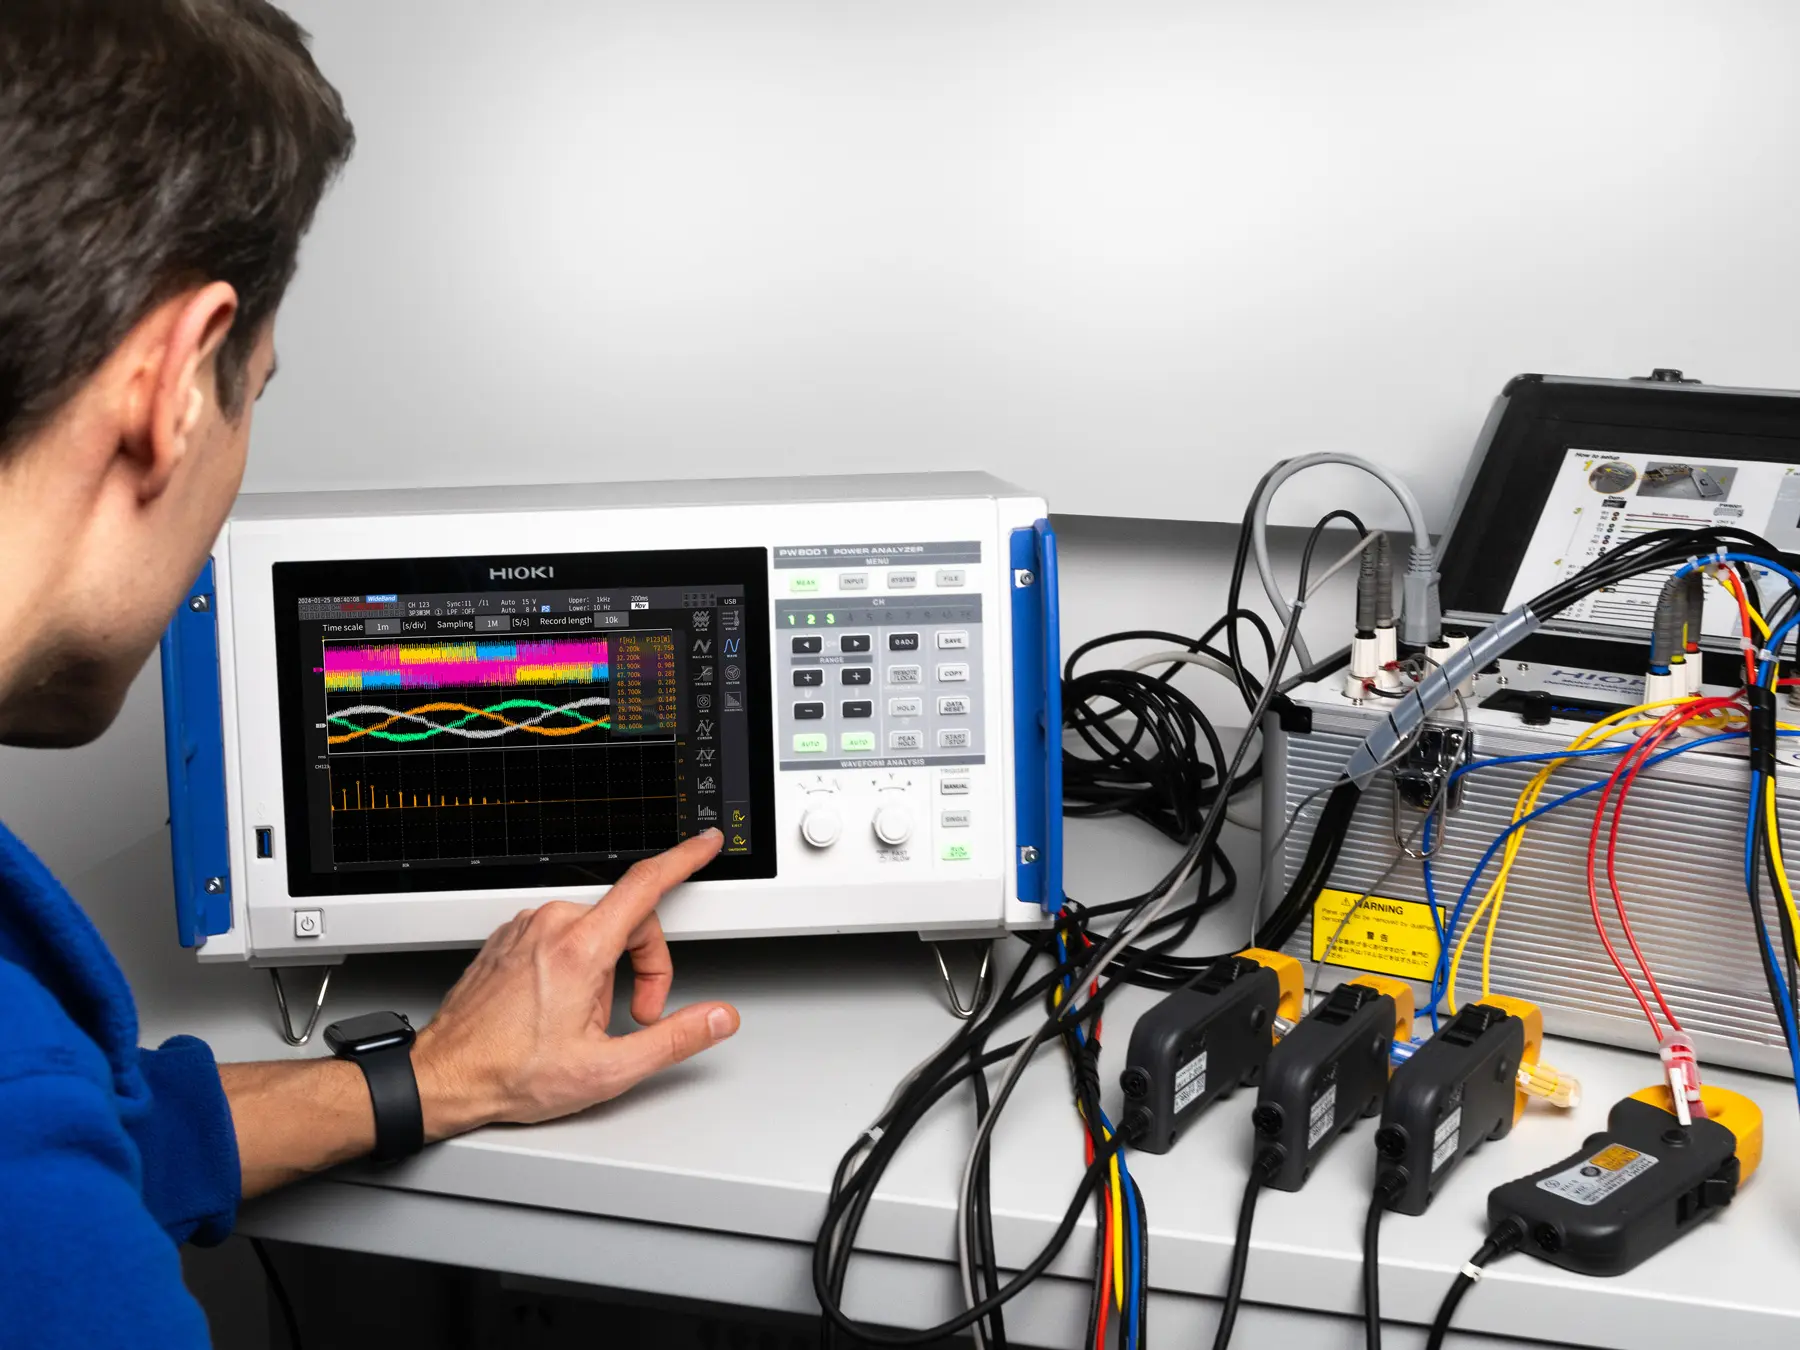
For a comprehensive view of power losses across the entire frequency range, an advanced feature like Power Spectrum Analysis (PSA) is required. PSA uses FFT but isn’t restricted to the main motor frequency; instead, it covers the full frequency range of the power analyzer – up to 6 MHz in the case of HIOKI’s PW8001. As a result, PSA opens up new possibilities for identifying losses that may remain undetected with conventional methods.
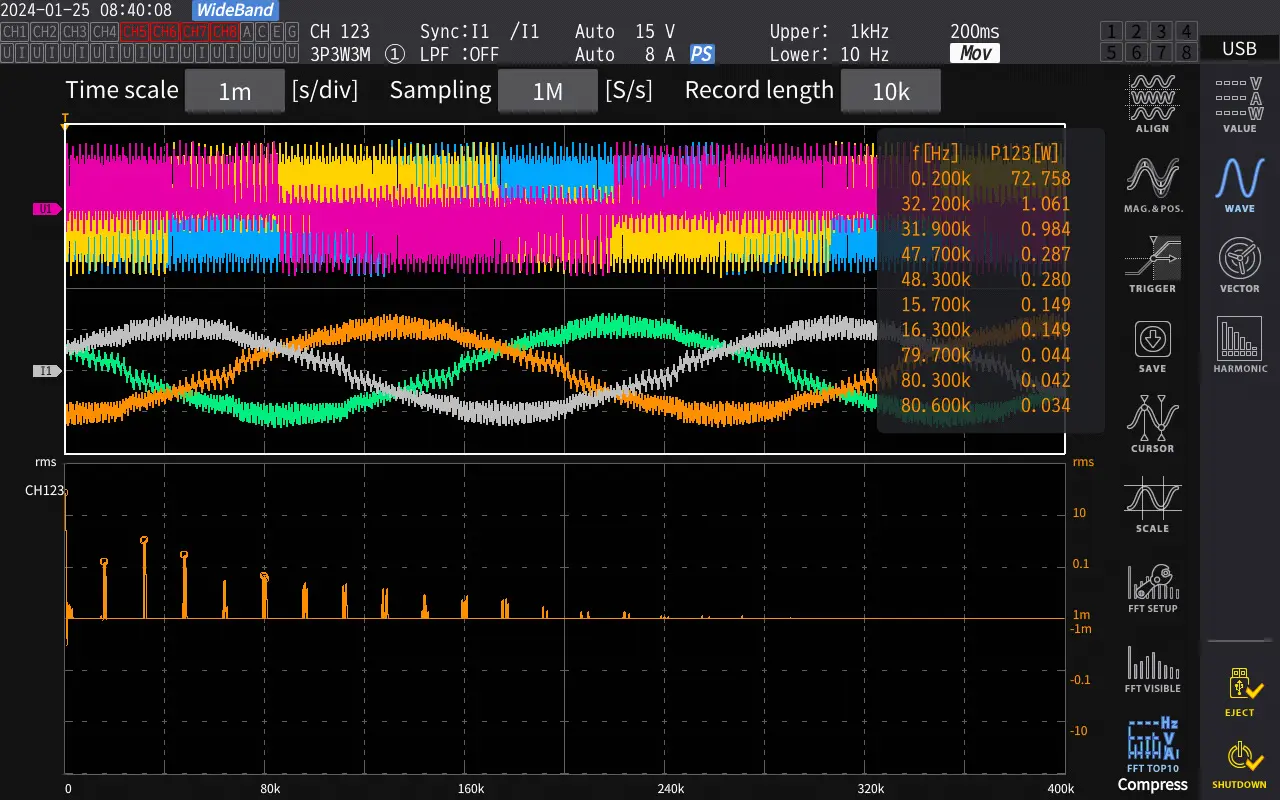
To use the PSA (Power Spectrum Analysis) function effectively, two key conditions must be met:
- Any phase shift introduced by the current sensors must be accurately compensated by the analyzer
- The current sensors must provide a flat amplitude response across the entire frequency range
When both conditions are met, power losses can be accurately identified across all relevant frequencies.
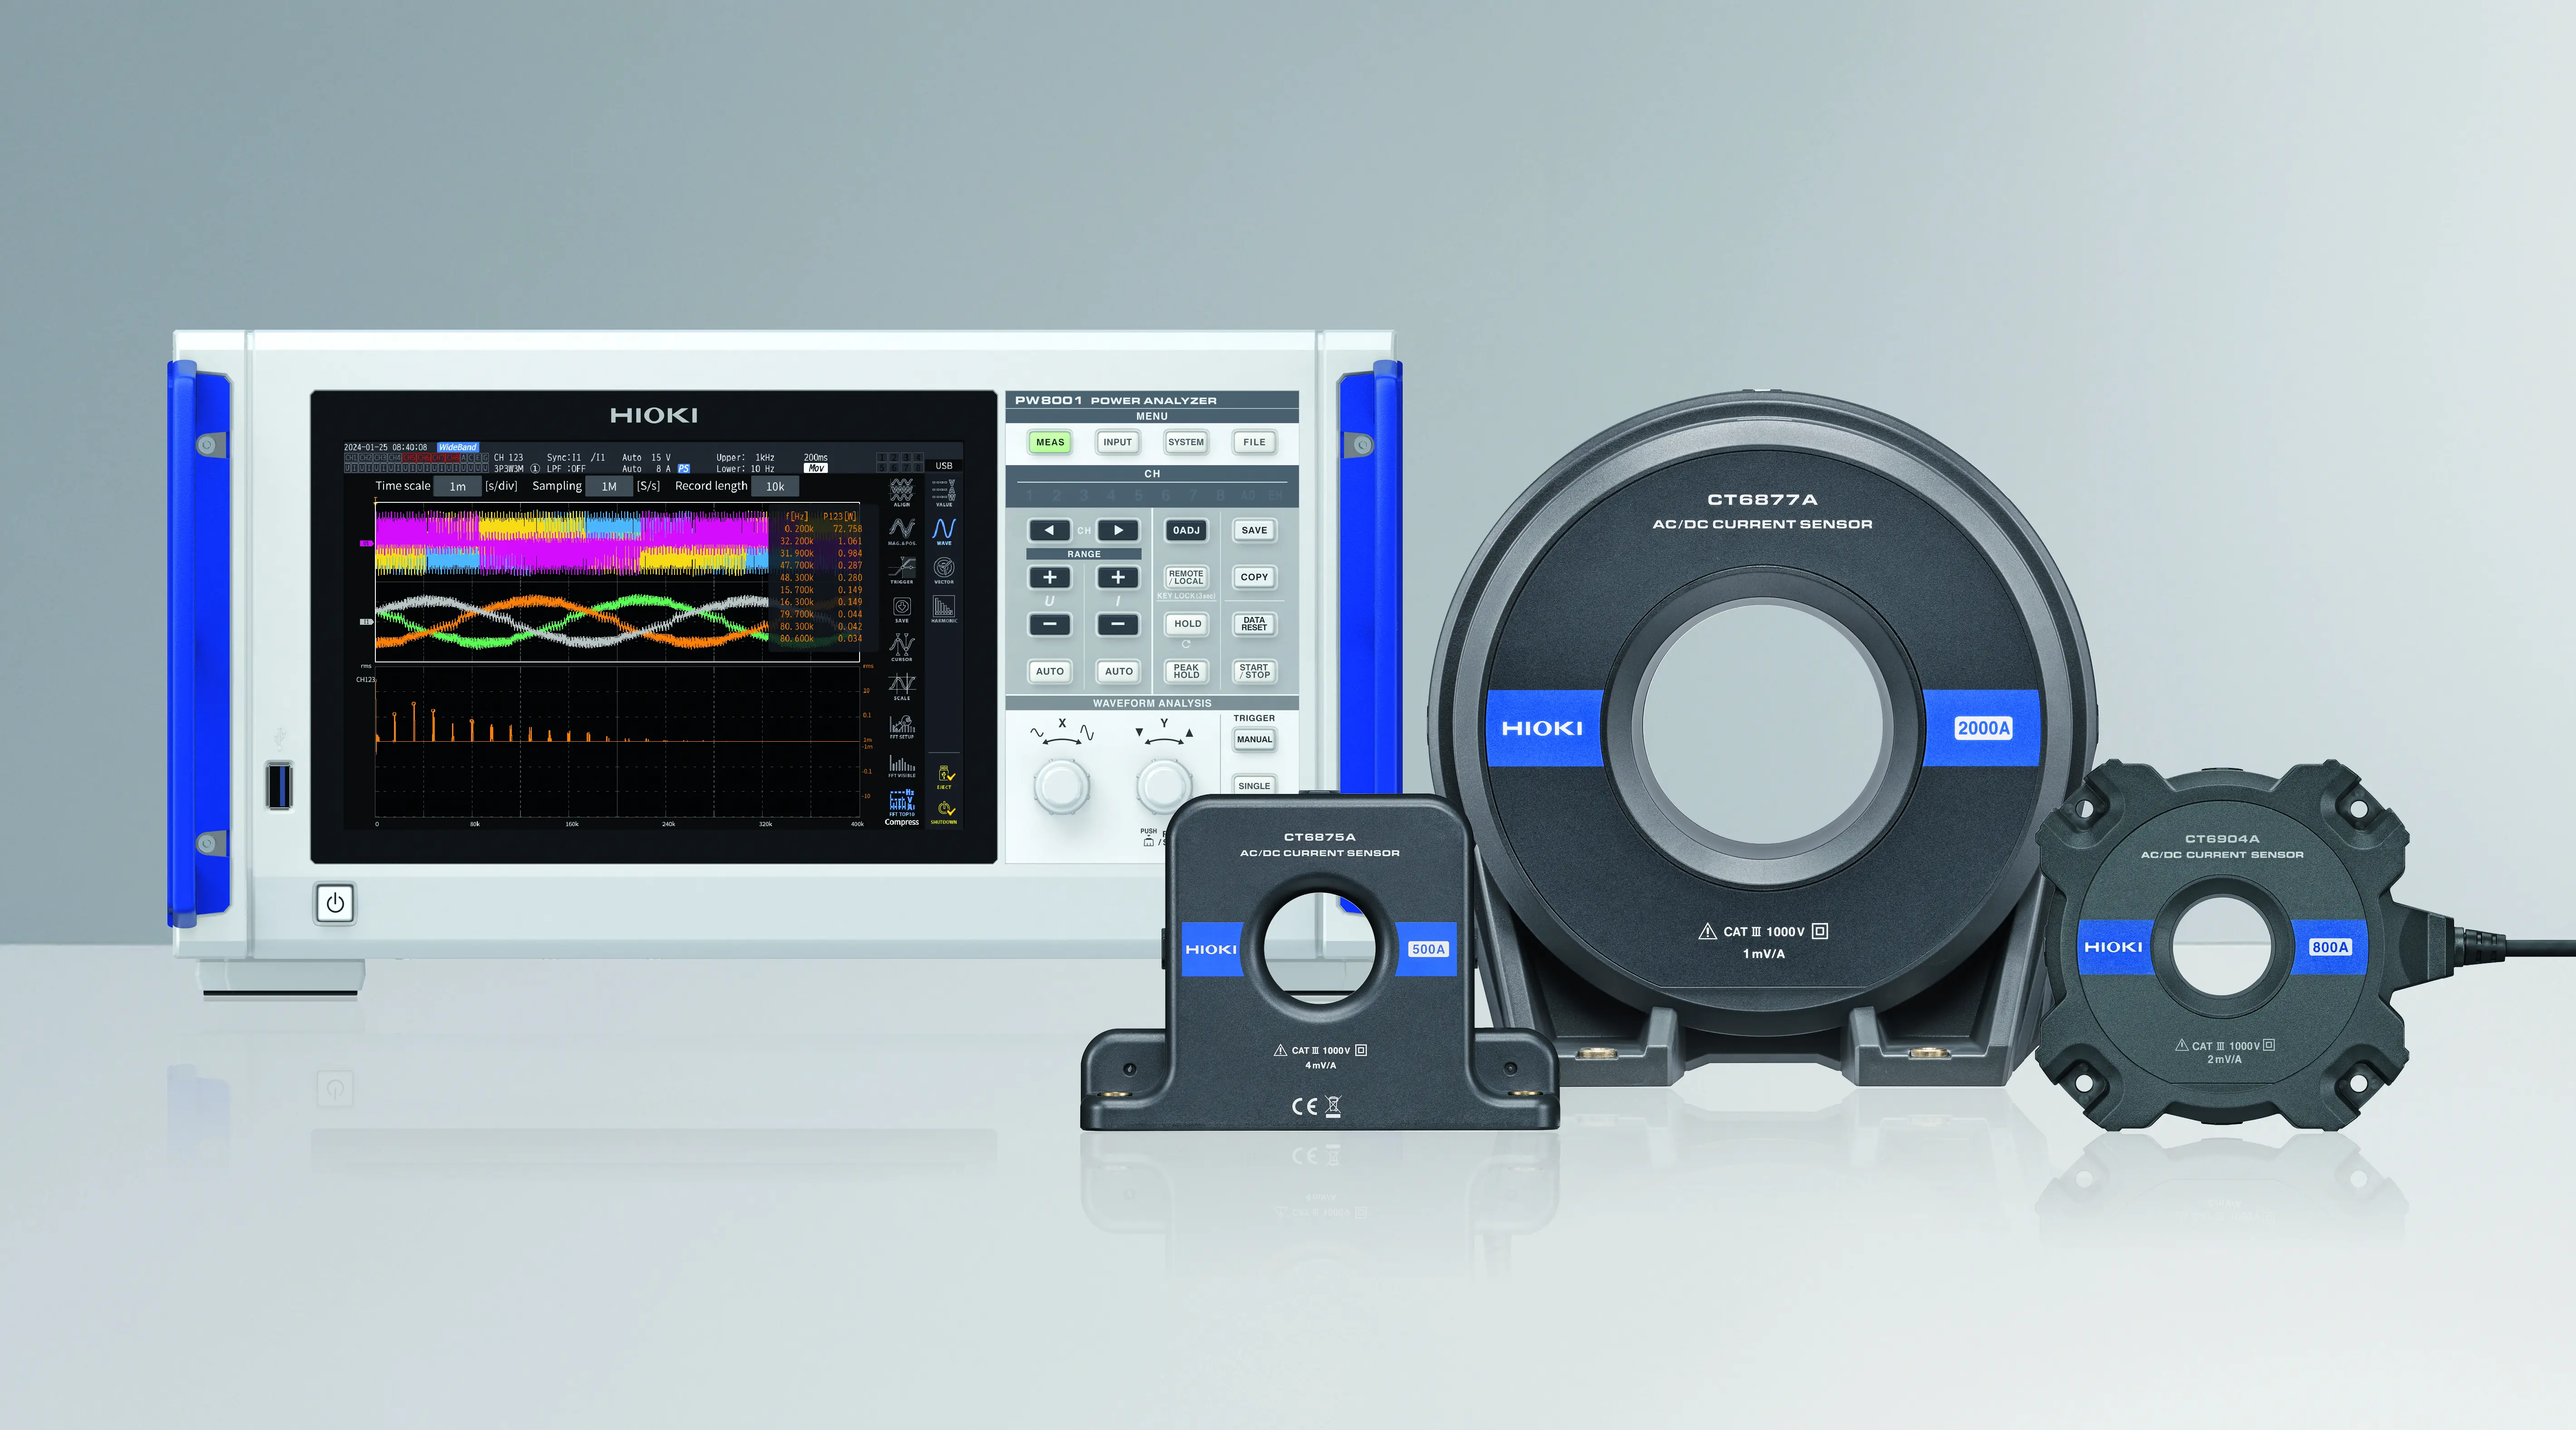
Tracing Power Losses: Power Analyzer and Current Sensors from a Single Source
Since HIOKI designs, engineers, and manufactures both the power analyzer and current sensors in-house, these components are optimized for high-frequency power measurements. This high level of accuracy provides confidence in precise determination of power loss and pinpointing where power has gone. This is a critical step toward improving energy efficiency in motors, inverters and other power electronics applications.
PW8001
PW8001 - Modular 8-channel High Precision Power Analyzer
High-precision power analyzer for analysing the efficiency of inverters and inverters with basic accuracy of ±0.03%, sampling rate of 15 MHz, 18-bit AD converters, automatic phase shift correction, data update rate of 1 ms.
CT6877A
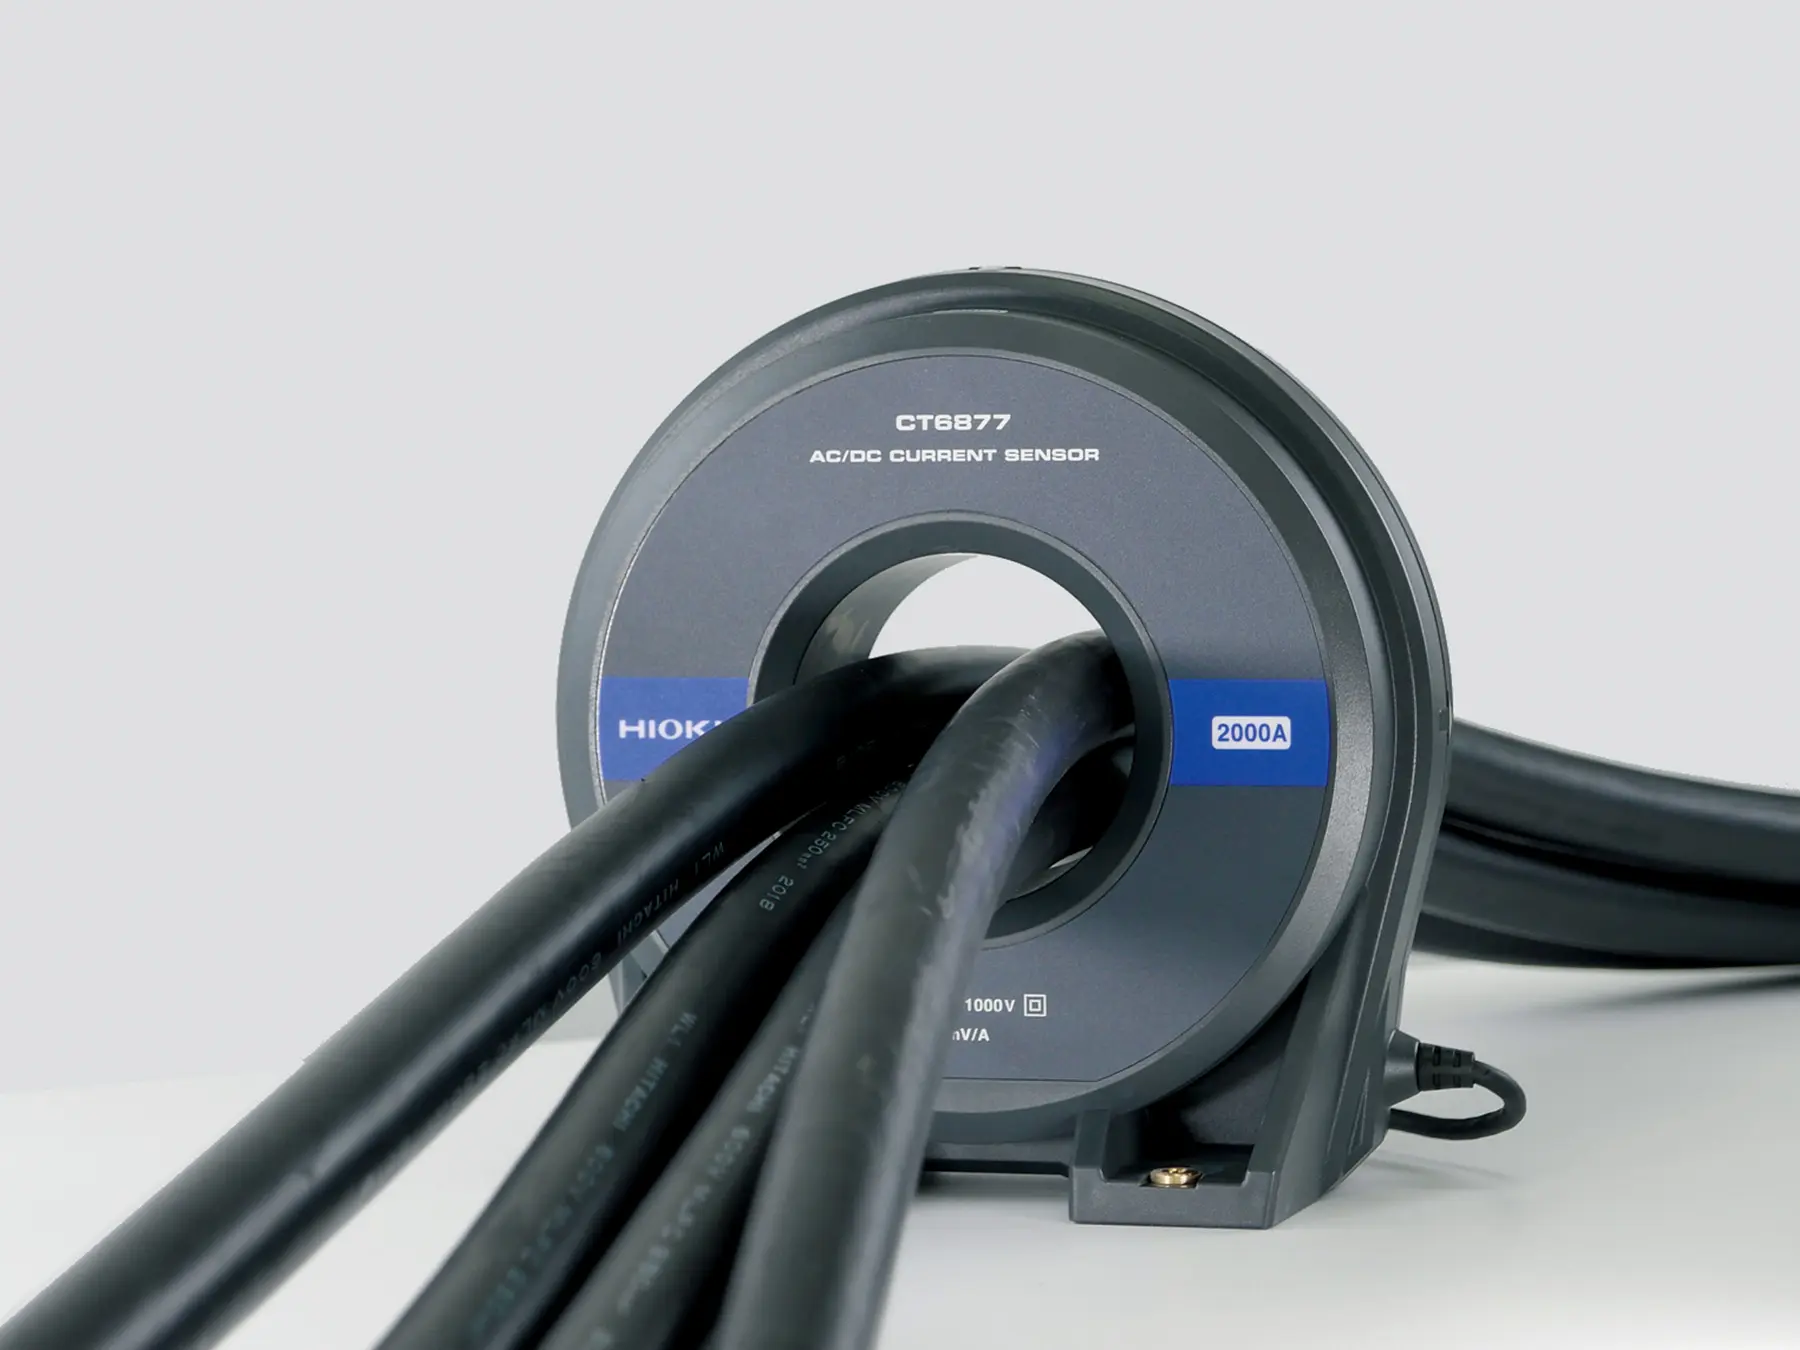
CT6877A - AC/DC-Current sensor, 2000 A / 1 MHz
Hioki's pass-through AC/DC current sensors are premium devices for use with power meters, memory HiCorders and high performance oscilloscopes.
CT6875A
CT6875A - AC/DC Current sensor, 500 A / 2 MHz
The CT6875 AC/DC Current Sensor is designed for accurate current measurements across a broad frequency range, from DC to 2 MHz (Model CT6875-01: DC to 1.5 MHz). With a rated current of 500 A, it is ideal for R&D, quality evaluation, manufacturing, and maintenance in industries such as wireless charging systems, inverter motors, PV power conditioners, and EV quick charging facilities. In combination with the Power Analyzer PW8001, the sensor allows for precise high-frequency and low power factor measurements. Technical Details: Rated Current: 500 A Frequency Bandwidth: CT6875: DC to 2 MHzBasic Accuracy: Amplitude: ±0.04 % rdg. ±0.008 % f.s., Phase: ±0.08° Maximum Conductor Diameter: 36 mm Maximum Rated Voltage to Ground: 1000 V CAT III Operating Temperature: -40°C to 85°C Input Impedance Requirement: 1 MΩ or higher Output Terminal: ME15W Cable length: 3mMore than specs – find more details here: Measure Power with Precision – Across All Applications
CT6904A
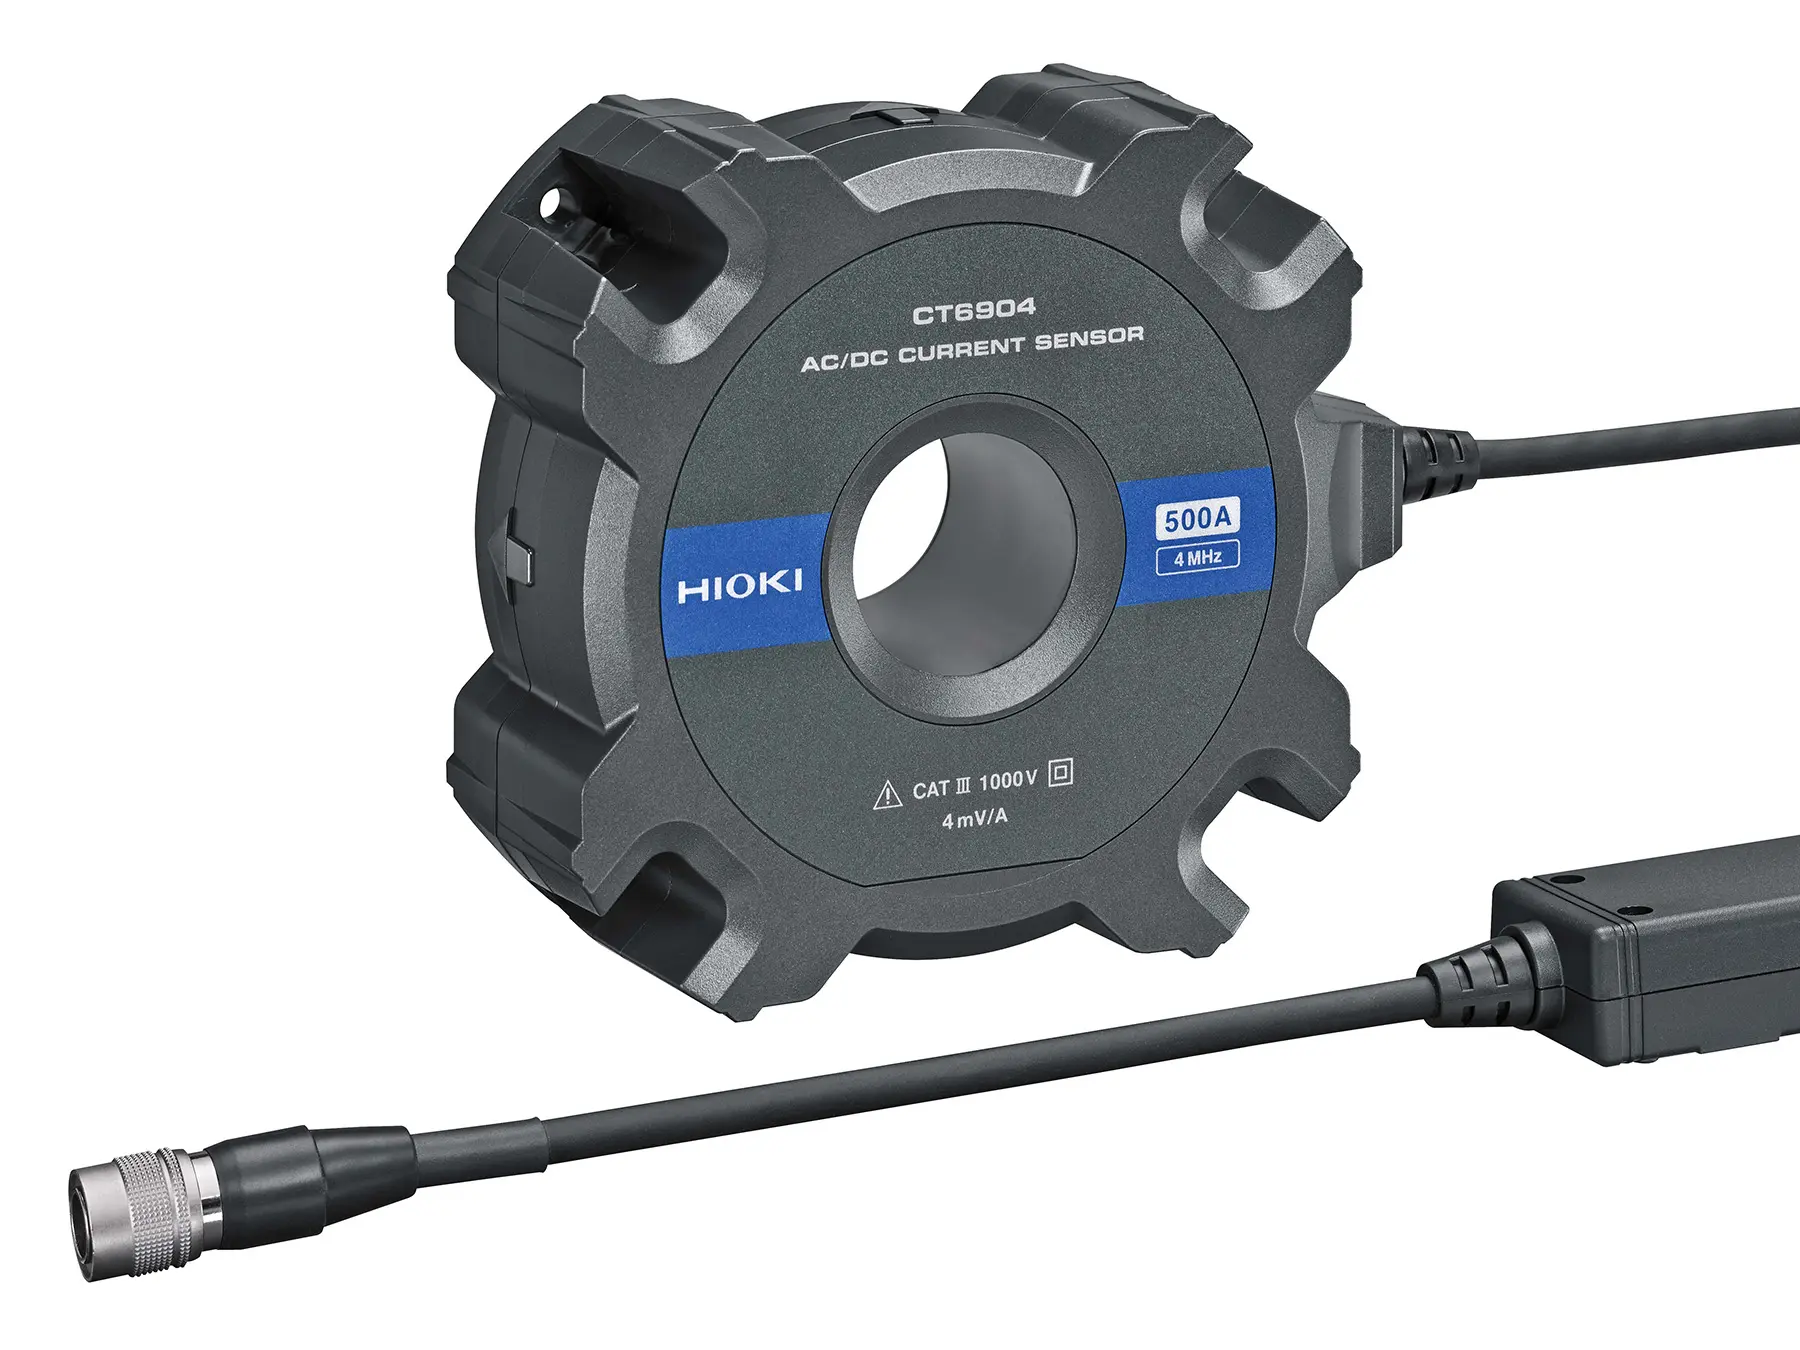
HIOKI CT6904A - High-precision AC/DC current sensor, 500 A / 4 MHz
HIOKI CT6904A AC/DC current sensor with 500 A range and 4 MHz bandwidth for accurate current measurements in power electronics and test environments. Order now from HIOKI Europe.

